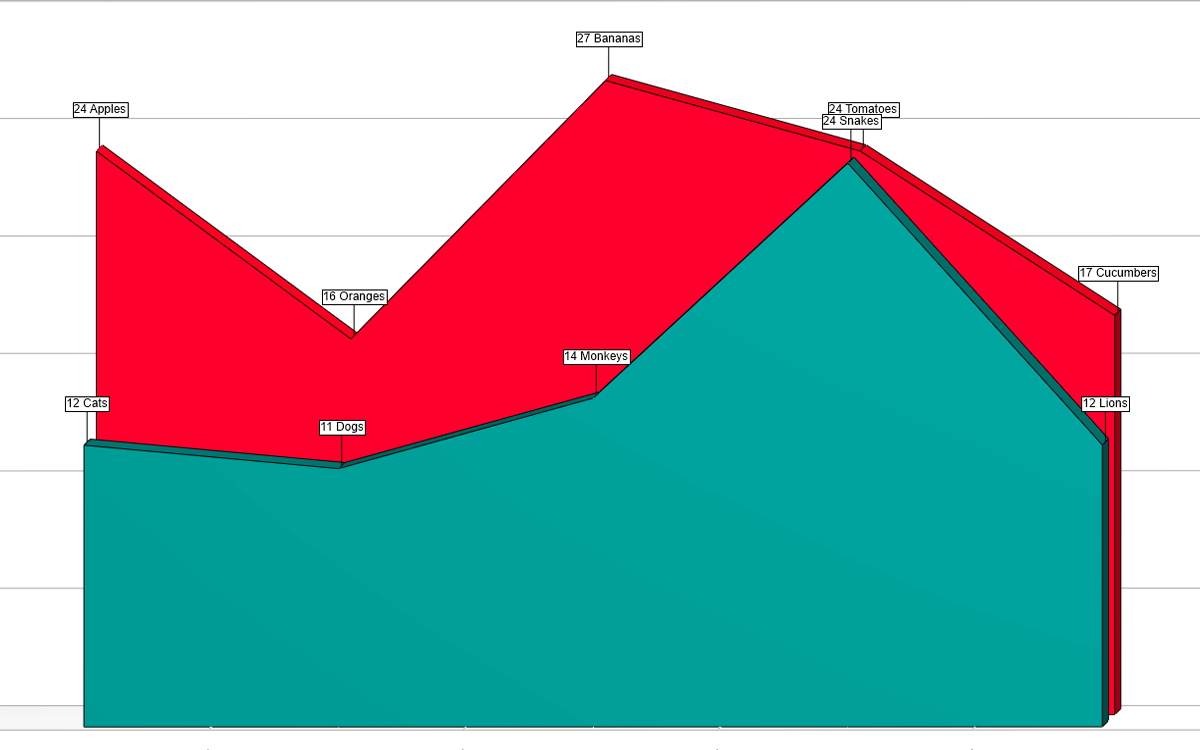
Add 2D/3D charts and graphs to your Windows Forms applications quickly and easily. Includes all the features you are likely to need, and is written in 100% managed code. Integrates well into dashboard and business intelligence software. Backed by a responsive support team.


Explore Cost-Effective Bundles Tailored for Your Needs
Starting
$1,379.95 US
Add 2D/3D charts and graphs to your Windows Forms applications quickly and easily. Includes all the features you are likely to need, and is written in 100% managed code. Integrates well into dashboard and business intelligence software. Backed by a responsive support team.
Part of Xceed Ultimate Suite
The fast, feature-rich chart control for Windows Forms.
The only .NET chart control for Windows Forms that uses OpenGL (supported by nearly all graphics cards) for fast, real-time rendering of charts, with fallback to GDI+ like other chart controls. Written in 100% managed code, and loads quickly.
Used by companies in their software for over 10 years, and trusted by Microsoft for use in one of their Windows server operating systems.
Supports all the most commonly used 2D/3D chart types, and a few that aren’t so common. Provides flexible axes, scaling, legends, drill-down, built-in toolbar and data grid, 30+ formulas, multi-chart display, and more. Includes a chart explorer application so you can experiment with the charts without having to write code first. WYSIWYG editors let end-users customize charts themselves.
Also provides unique capabilities such as run-time chart editors so end-users can create and modify charts themselves, multiple light sources, and has built-in grid and toolbar components to make the control more usable, expose common chart commands, and facilitate the integration of data-editing features into applications.
To continue enjoying our services without interruption, please contact our sales team to renew your subscription.
Please, contact us at support@xceed.com if you think this is a mistake.
Here are all the latest updates to this product
No versions available at this time.